A Case Study of Inventory Management in Select Five Pharmaceutical Companies.
Mr. Aditham Prakash Rao
Key words: - Inventory Management, Deterioration, Minimize, Circumstances
1. Introduction :
Inventory comprises of the sum total of the raw materials, work in progress and finished goods in case of manufacturing companies whereas it comprises of only finished goods in case of trading companies.
Inventory means money. However, it is not the same as money in the bank. It is the money on which we pay interest instead of earning interest as in the case of money with bank. Holding of high levels of Inventories not only block funds but also entitles the cost of carrying the inventories. Therefore, inventory carrying cost is a hidden cost and it comprises of the following main components: capital cost, cost of storage and handling and deterioration and obsolescence cost. The cost of inventories also constitutes an opportunity cost in that it is the cost which is incurred in withdrawing funds from productive activity to invest them in inventories.
Inventory would be unneeded if the production and sales could exactly match at all times. In other words, this would be possible only if, production and sales could occur at the same moment. This preposition is practically difficult in the present circumstances. In case of Pharmaceutical companies, the inventories constitute a major portion of the current assets as well as the total assets. Inventories need to be maintained at appropriate levels so as to minimise the costs of holding and carrying them. A huge amount of funds is blocked in inventories extending to over 6-8 months. A company needs to achieve sufficient sales volume to sustain the maintenance of inventories. Therefore, a study is made to understand the inventories practices followed in a sample of five select pharmaceutical companies.
2. Objectives of study :
To understand the inventory holding periods followed by the companies under study over the last five years and to interpret their performance.
(i) A sample of five companies having a sizable turnover in pharmaceutical sector have been randomly picked up for study.
(ii) The figures have been collected from the published annual reports of companies for the last five years.
(iii)The inventory levels maintained by these companies and their profitability have been studied based on ratio analysis technique employing the following well known ratios over five years for the selected companies.
(a) Number of days of inventory holdings.
(b) Inventory turnover ratio
(c) Materials Consumption ratio
(d) Net Profit Ratio
4. Companies selected for study.
(i) Cipla
(ii) Dr. Reddy Laboratories
(iii) Sun Pharmaceuticals.
(iv) Glenmark Pharma
(v) Torrent Pharmaceuticals
5. Discussion and Analysis :
A. Cipla (Rs in crores)
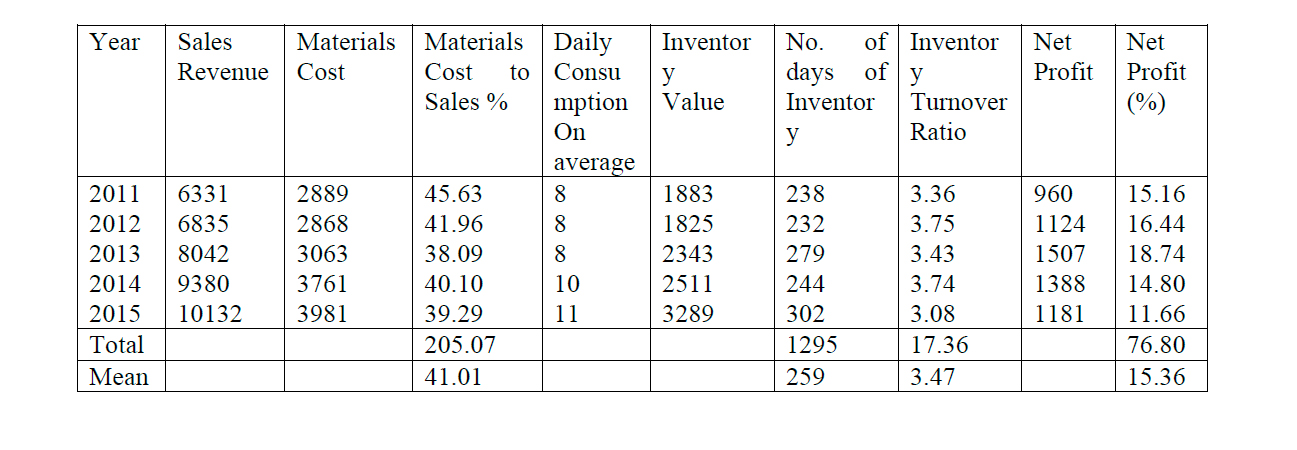
1. On an average, the number of days of inventory holding for the company is 259 days; which is on a very higher side.
2. The materials cost percentage to sales revenue is also on higher side i.e 41% on an average.
3. The inventory turnover ratio is as low as 3-4 times, on an average, reducing to 3 times during the year 2015.
4. The profitability as indicated by the Net profit ratio is adversely affected standing at 11.66 % which has declined from 18.74 % in 2013.
5. During the year 2015, the number of days of inventory holdings have exceeded 300 days indicating inventory holding for 10 months in the year.
6. Even though the sales turnover has shown an increasing trend over the last five years, the profitability has declined over the last three years.
7. All the above indicate that the Inventory management is not being efficiently managed.
8. The performance pattern over the last three years indicate increasing sales volume, with decreasing profitability and increasing number of days of inventory.
9. The daily consumption of materials on an average shows an increasing trend.
10. The company needs to work on their inventory levels to bring within favorable parameters.
B. Dr. Reddy Laboratories
(Rs in crores)
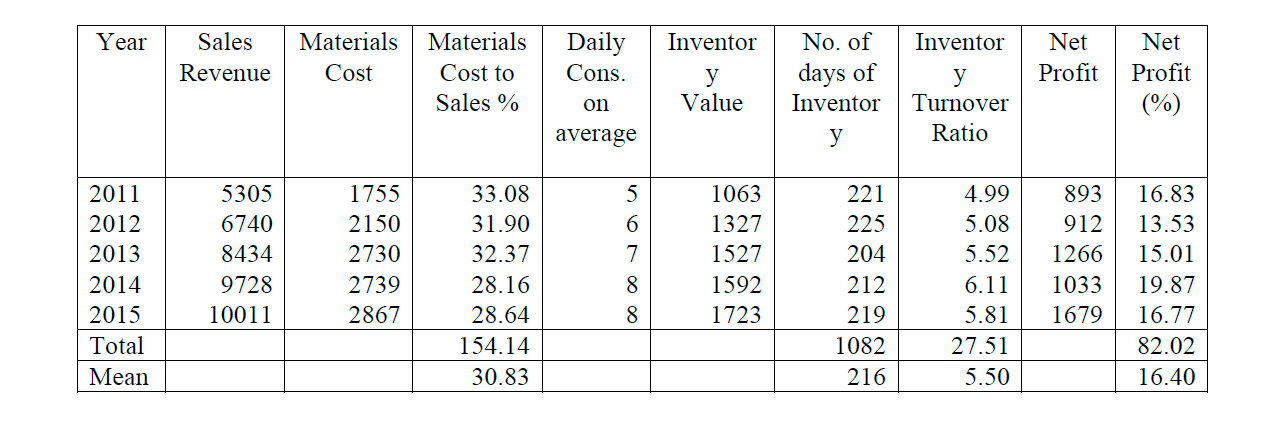
Inferences:
1. Material consumption cost to sales revenue is 30.83% on an average during the last five years.
2. The number of days of inventory holding is 216 days on an average.
3. The inventory turnover ratio is 5.5 times on an average.
4. The above ratios indicate that the company has managed its inventory policy with a comparatively low material consumption ratio.
5. Sales volume has shown an increasing trend over the last five years.
6. The net profit shows an increasing trend in the years: 2012, 2013, however, it has declined in 2014, but the profitability on sales has shown a good increase at 19.87% in the same year.
7. In the year 2015, although the sales have increased, but the net profit shows a decrease at 16.77 %. However, the inventory has been reasonably maintained at 219 days.
C. Sun Pharmaceuticals.
(Rs in crores)
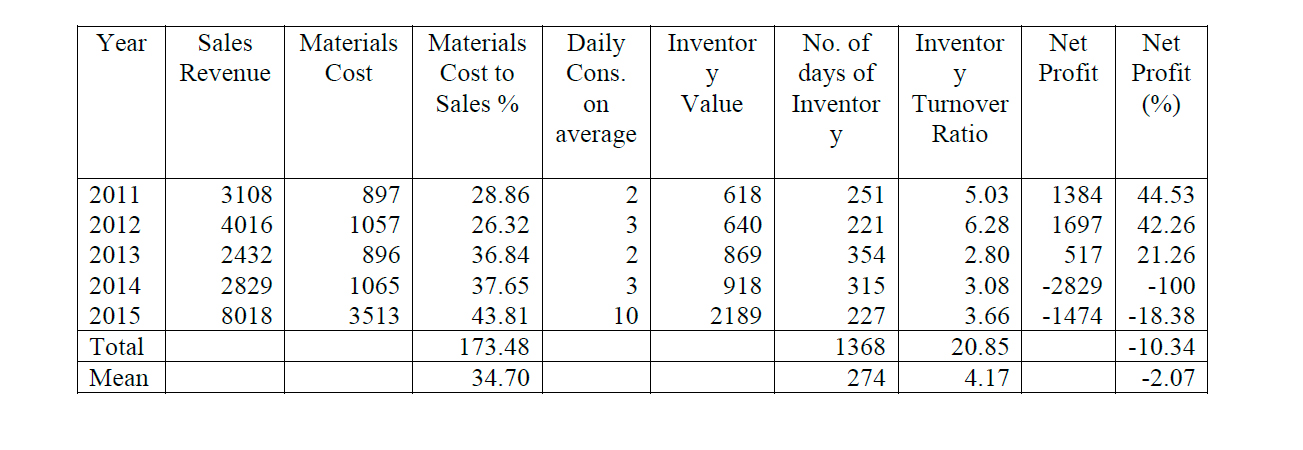
Inferences:
1. During the last two years, the company’s performance has declined very sharply. During the year 2015, the company has increased the turnover to a significant extent but was not able to improve its profitability.
2. During the five year period, the number of days of inventory holding is 273, which is quite high.
3. The material consumption ratio has increased to 43.81% which is also quite high.
4. The inventory turnover ratio also is at a low rate of 3 times.
5. During the year 2014, the company incurred a heavy loss which has affected its performance during the last two years.
6. The profitability was very good during the initial years of the five year period.
7. For some reasons which have not been analyzed, the results for the year 2014 were at its worst during the five year period.
8. During the year 2015, some improvement is seen with still a negative figure of profits.