TECHNICAL ANALYSIS REPORT OF RELIANCE INFRASTRUCTURES LTD
- Ms. Bharat Dalal
ABSTRACT:
This Research Report covers Reliance Infrastructures LTD which belongs to the Anil Ambani (ADAG) group having presence in Infrastructure, Power Distribution etc. The stock appears to have commenced a fresh and dynamic growth phase, having a very favorable risk / reward ratio and is expected to do well in the future.
KEY WORDS:
Technical Analysis
INTRODUCTION
This is a Technical Analysis report of RELIANCE INFRASTRUCTURES LTD covering a time frame of medium term to long term. Medium term time frame covers 1 to 2 years whereas long term time frame covers more than 2 years.
RESEARCH METHODOLOGY
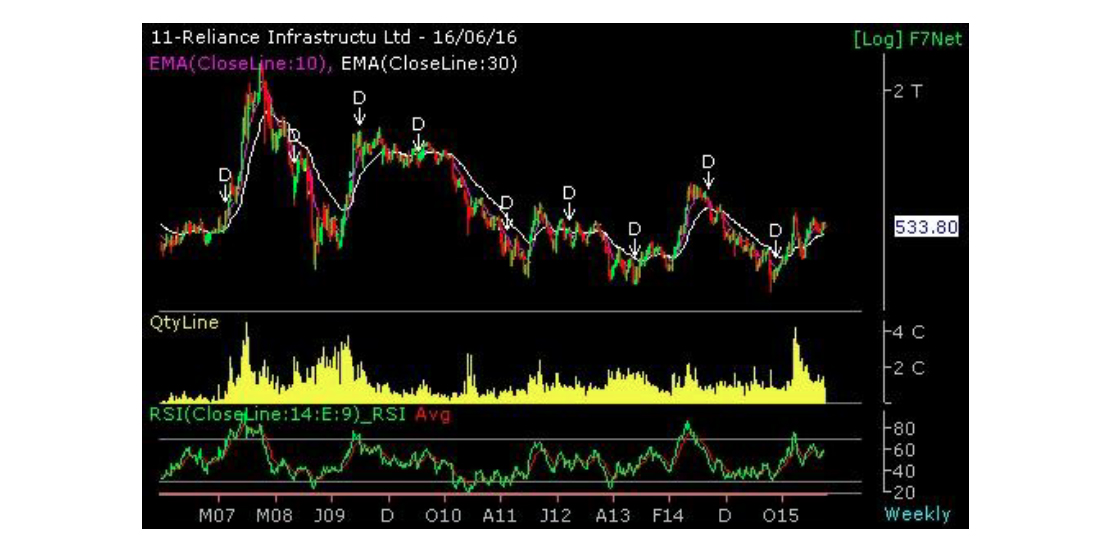
For the said Research the methodology used is Elliot Waves, Patterns, Support & Resistance levels, Exponential Moving Averages like 10W EMA & 30W EMA, Bar Charts, Trend lines, Volumes and Relative Strength Index (RSI) for the Weekly and Monthly Charts.
PRIMARY DATA
The primary data is collected from National Stock Exchange (NSE) is as follows:
1) Weekly Charts from July 21, 2006 to June 16, 2016
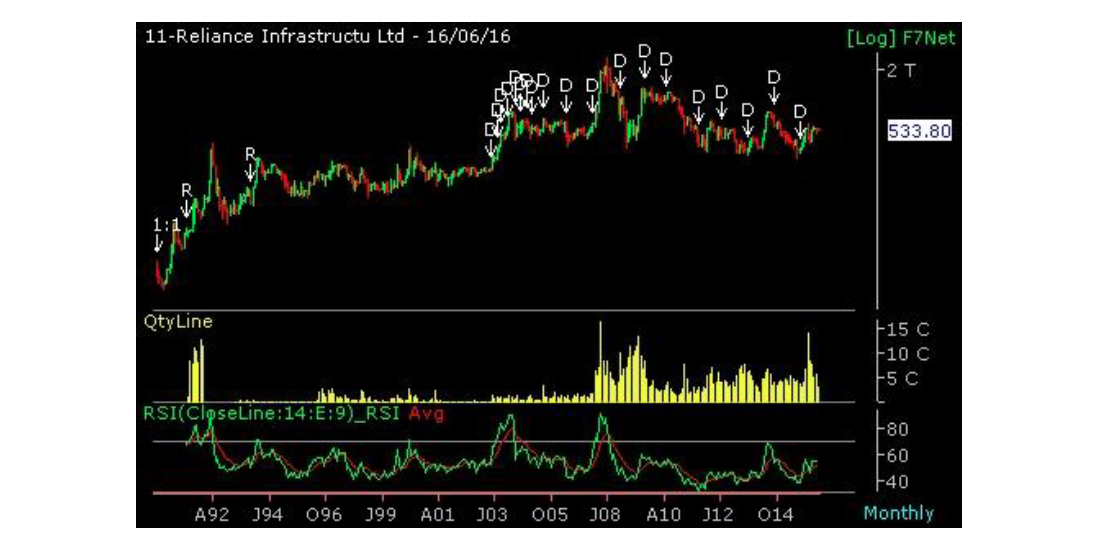
2) Monthly Chart from January 1990 to June 16, 2016
ANALYSIS & INTERPRETATION
Its Monthly chart (long term) indicates that it completed one bull phase at Rs 2641/ (Jan 08). It made a low of Rs 352.75 (Oct 08). A corrective rally made it give a lower top of Rs 1404.50 (Oct 09). Thereafter, it completed the second leg of the fall after making lower tops / bottoms formation by reporting a low of Rs 281.55 (Aug 15). It seems to have started a new bull phase and completed the first internal up move at Rs 621.90 (Jan 16). This stems from the fact that the RSI has given a positive divergence in the oversold zone. Present downward move seems to be a correction of this last up moves from Rs 281.55-621.90 level. It has support at Rs 510 / 460 / 390 levels and will also face Resistance at Rs 580 / 660 / 725 levels. Once this corrective phase gets over then this stock should begin its second up move of this new bull phase and this is expected to be a dynamic one. In such a scenario coming to be true i.e.it does not break the low of Aug 15, then it should easily target a price of Rs 2600-2800 in the next 2-3 years. On weekly chart, its 10W EMA stood at 529.02 and its 30W EMA stood at 498.19 levels.
Conclusion – A growth stock meant for long term investors to be acquired in 2-3 lots on declines. A good large cap portfolio stock with very favorable risk / reward ratio
BIBLIOGRAPHY / REFERENCES –
Falcon software of Reliable Software systems P Ltd which in turn takes the data from National Stock Exchange (NSE). The report was prepared on June 16, 2016 using the closing price of (INR) 533.80 of RELIANCE INFRASTRUCTURES LTD up to June 16, 2016.
Statutory Disclaimer – The above Research Report is made from data acquired from the sources mentioned. This is not an invitation to buy the stock. Readers are advised to use their own analysis for investment / trading and neither the writer nor PIBM takes any responsibility for any losses etc suffered as a result thereof due to its usage. No claim as such will be admissible in any court of law.